Things
All of the below components are implemented as Salesforce Lightning Web Components. They can be included on the thing object’s Lightning Record Page, and can be shown / hidden from users using the filters available.
Thing Details
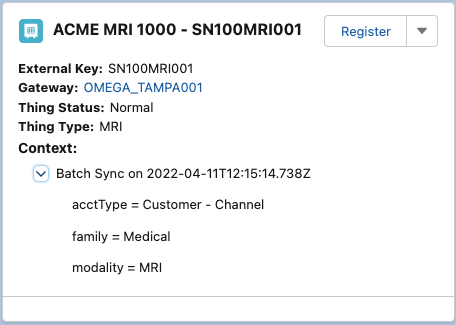
The Thing Details component shows the current status of a connected Thing. It shows:
- External Key
- The unique Id assigned to this thing / device.
- Gateway
- The Gateway this Thing is connected to.
- Thing Status
- The current IoT Status reported by this thing.
- Thing Type
- The
ThingType(from IoT Setup) that this thing will use. This value should not be edited outside of theRegisterAction. - Context
- The latest status on the synchronization of Salesforce “Context Data” that has been sent to the IoT Cloud for this thing.
Thing Details
Thing Registration (Thing Details)
The Thing Details component allows you to Register a new thing by selecting the following:
- External ID
- The unique Id assigned to this thing / device.
- Gateway Assignment
- The Gateway this Thing will be connected to.
- IoT Type
- The
ThingType(from IoT Setup) that this thing will use. This value should not be edited outside of theRegisterAction.
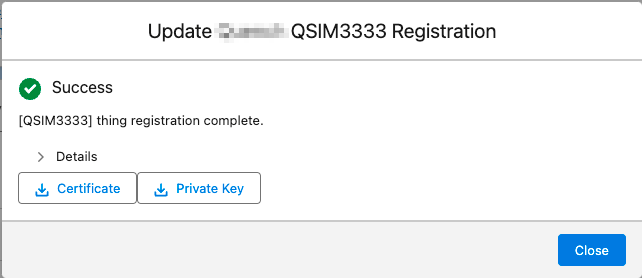
Thing Registration Certificates
The Thing Registration action returns the generated security certificates needed for connecting to the IoT Cloud. The Administrator can now download these certificates to handle the edge connectivity without leaving Salesforce.
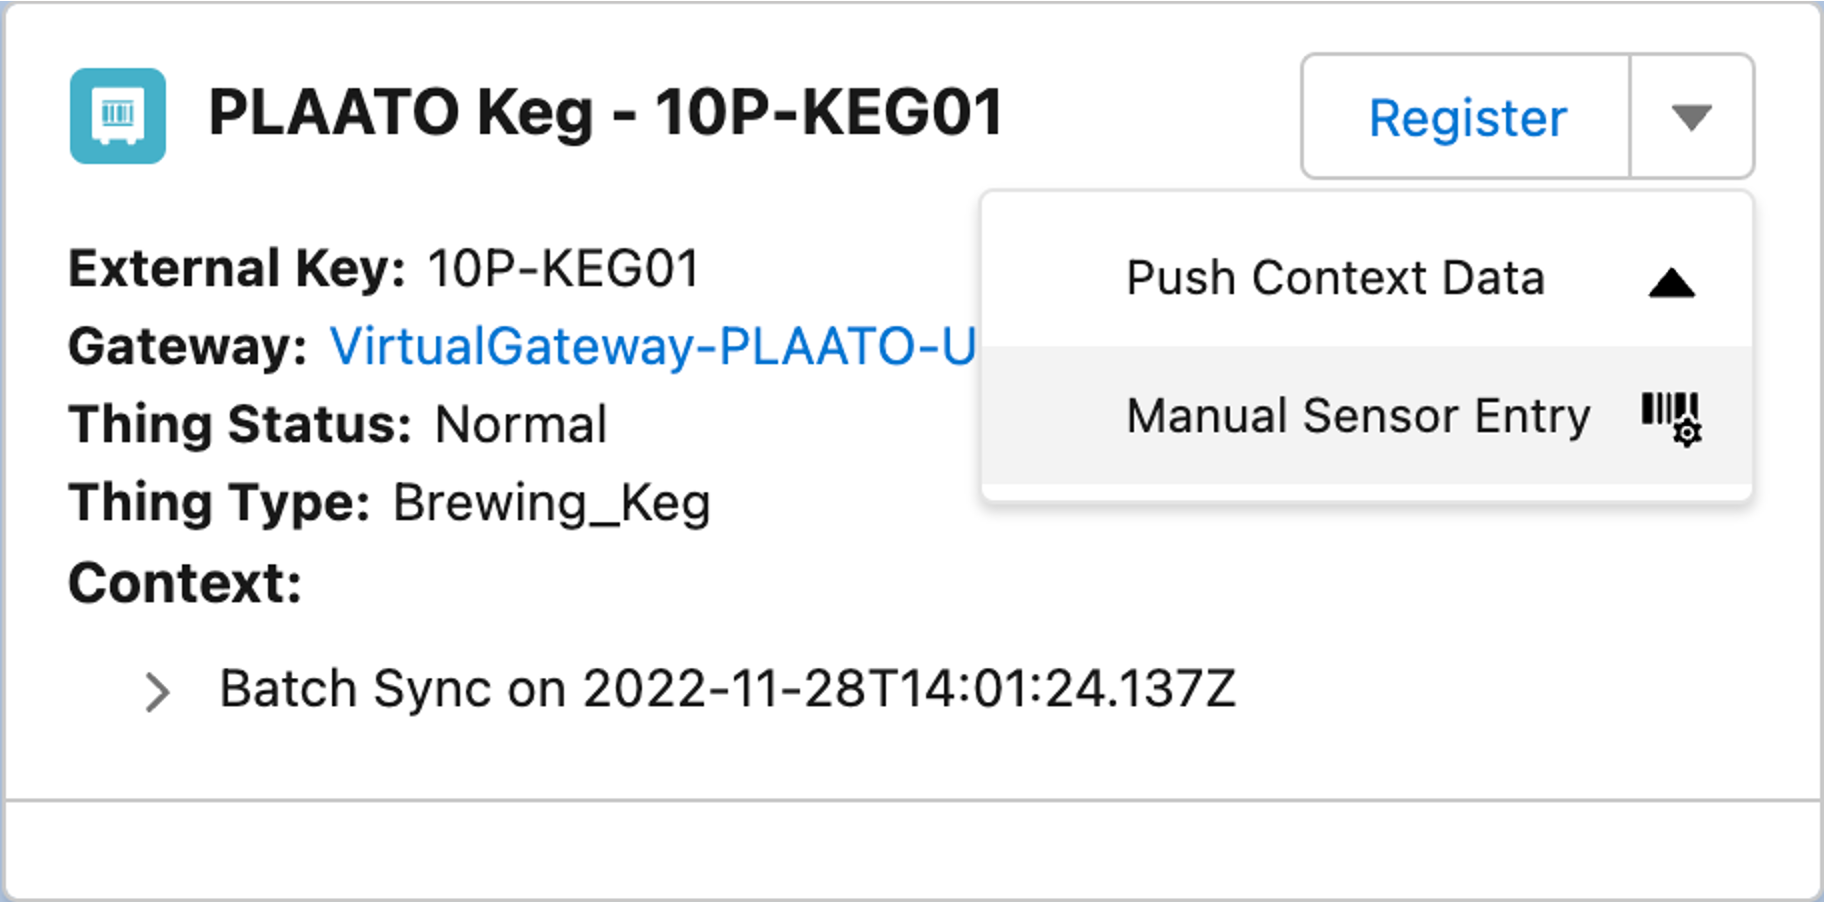
Push Context Data (Thing Details)
The Thing Details component allows you to manually push the Context Data for this specific Thing to the IoT Cloud.
This could be useful if the Context Values have changed for this Thing, and you don’t want to wait for the next scheduled Context Sync job to run.
After clicking the button, wait about 30-60 seconds and refresh the page to verify the updated Context Sync status.
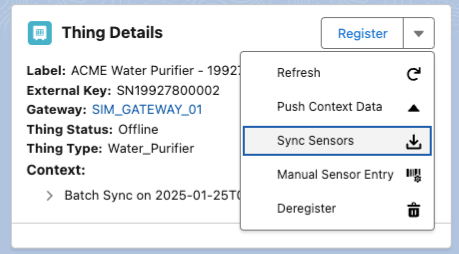
Sync Sensors (Thing Details)
The Thing Details component allows you to manually pull the latest Sensor Data for this specific Thing from the IoT Cloud.
This could be useful if the Sensor Data have changed for this Thing, and you don’t want to wait for the next scheduled Sensor Sync job to run.
After clicking the button, wait about 30-60 seconds and refresh the page to verify the updated Sensor Data records.
Thing Details
Manual Sensor Entry (Thing Details)
The Thing Details component allows you to manually submit Sensor Values for this specific Thing to the IoT Cloud.
Manual Sensor Entry Button
This could be useful if this Thing is not able to communicate due to security/firewalls or is temporarily disabled. The manually entered sensor values are uploaded and processed by the Rules Engine and stored in the IoT Cloud Data-Lake just like they would if they were received as a real IoT message.
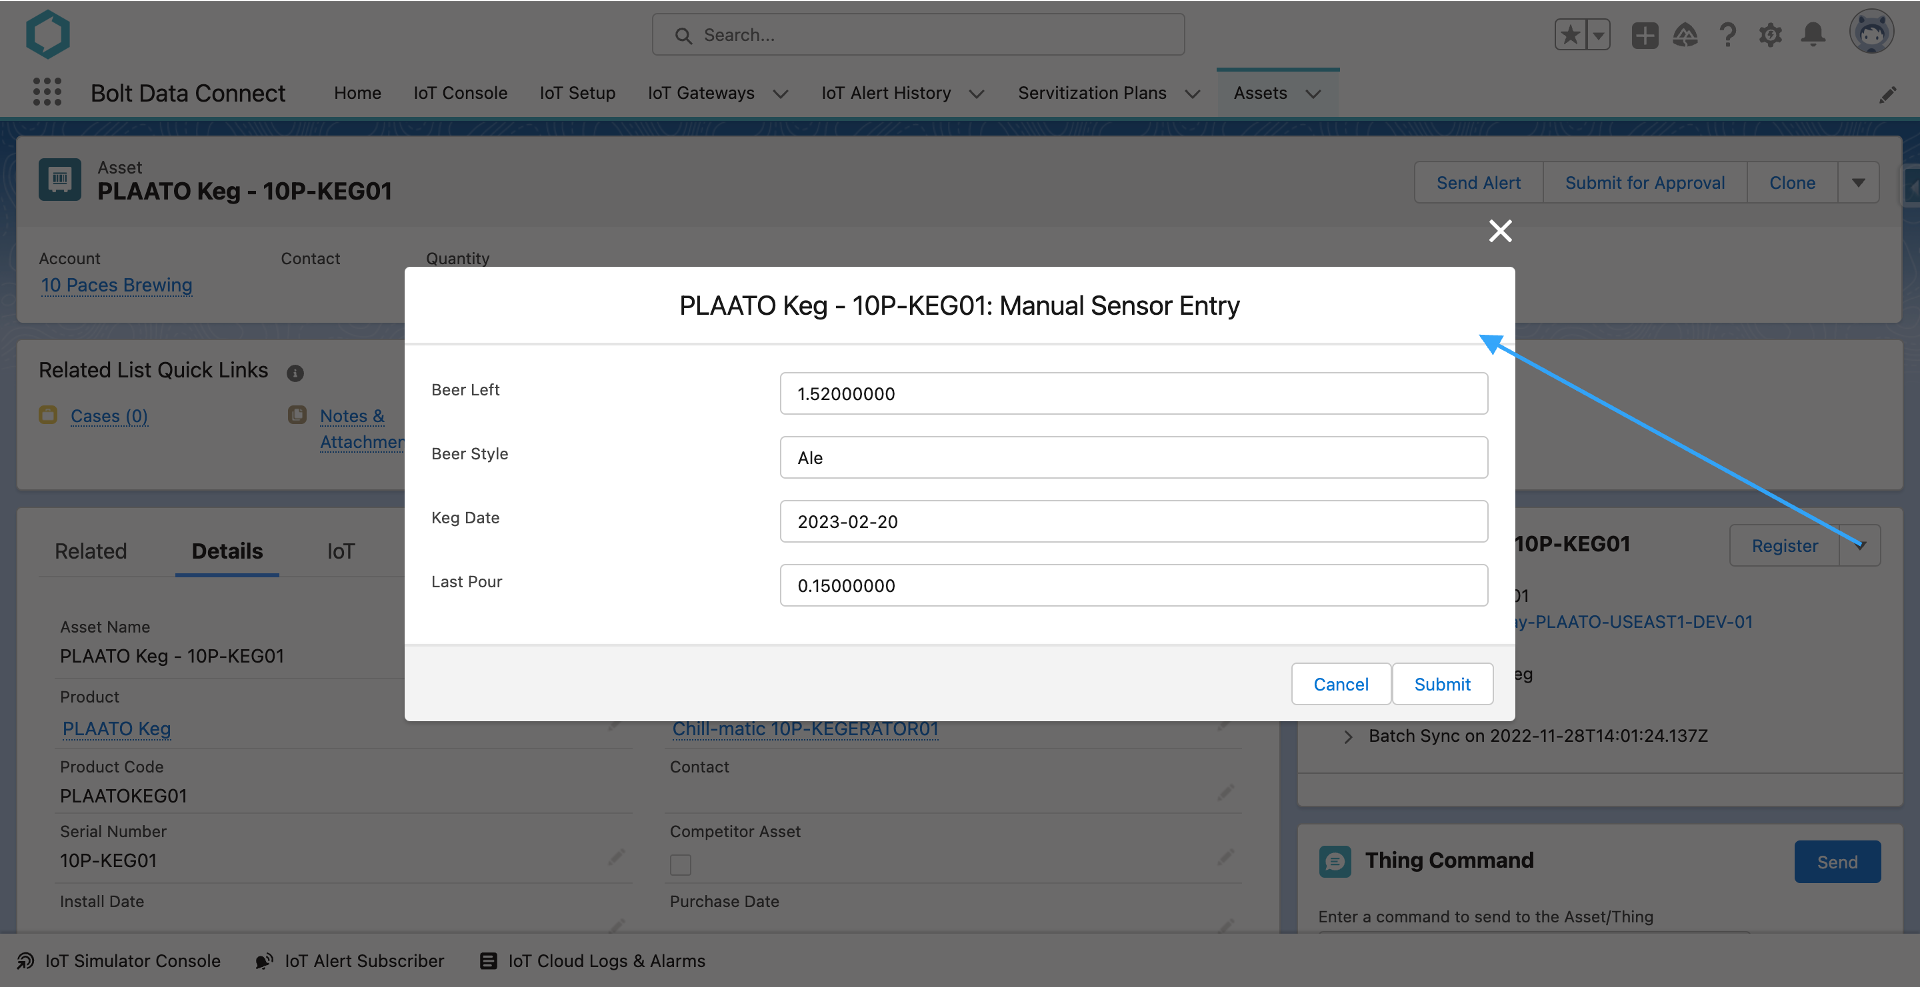
Manual Sensor Entry
Note
It’s important to add to this Manual Sensor Entry form is dynamic, based on the Sensors defined in the Thing Type. The Data Type and Storage Data Type influence the type / validation of each field on the form.Deregister (Thing Details)
The Thing Details component allows you to De-Register a thing. This will remove the thing from the registry and stop the flow of data and reduce device licensing.
Thing Data & Snapshots
By default, the 25 most recent messages will be displayed in the chart tab. This chart is fully interactive: zoom in/out, select/deselect sensors to hide/show them, scroll left/right, etc.
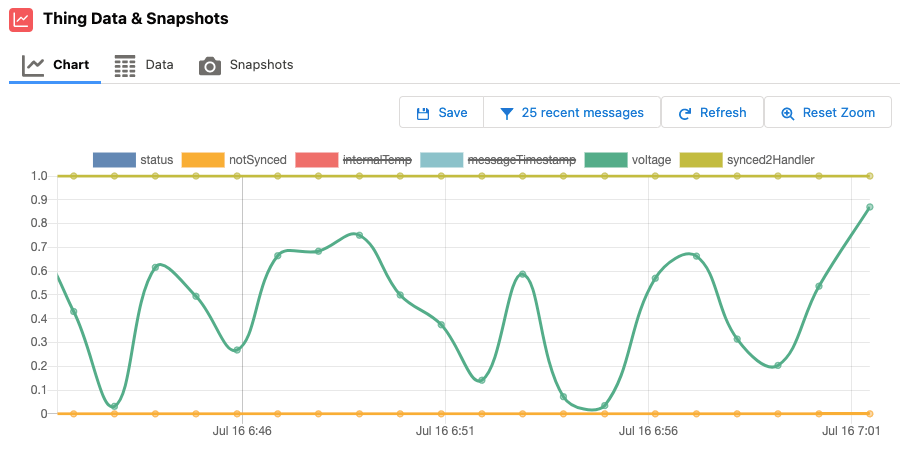
Thing Data Chart
The data tab allows you to see the same messages displayed in the chart tab, but in tabular/spreadsheet format, and download as a CSV file.
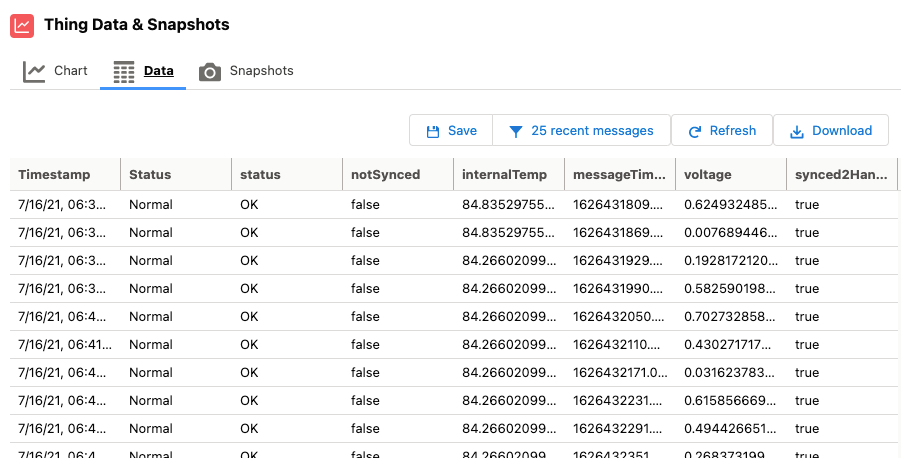
Thing Data Table
The snapshots tab allows you to view saved Snapshots and apply custom filters. Instead of the most recent 25 messages, the user can apply a dynamic filter for more messages and/or for a specific date/time range. Once a filter has been applied, you can also save the filtered data into a “Snapshot” in Salesforce attached to this thing record.
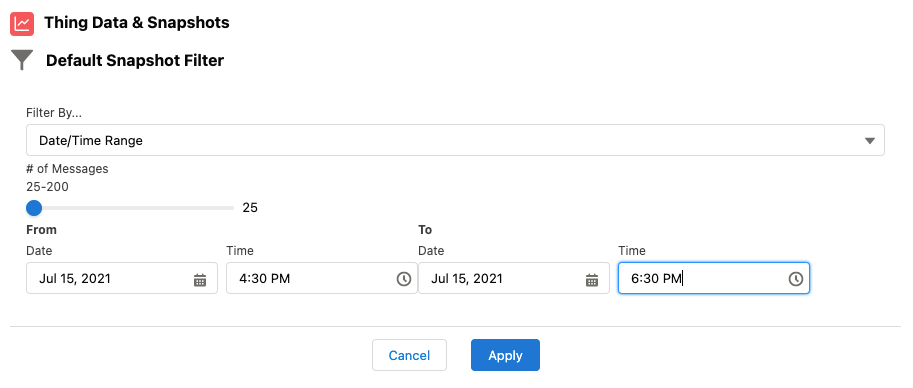
Thing Data Filter
Live Stream
The Thing Chart now has the ability to Live Stream IoT data. After clicking on the “Play” Stream button, you’ll see the chart re-draw with each new message as it is received from the IoT Gateway.
Thing Chart Live Stream
Note
It is possible to stream data for a period of time, and then save it to a Data Snapshot. Simply click the Save icon.Alerts
By clicking the Alerts button the Alert History for the current Thing will be overlaid on the Chart as vertical annotations, color coded with text descriptions of the Alert Type received.
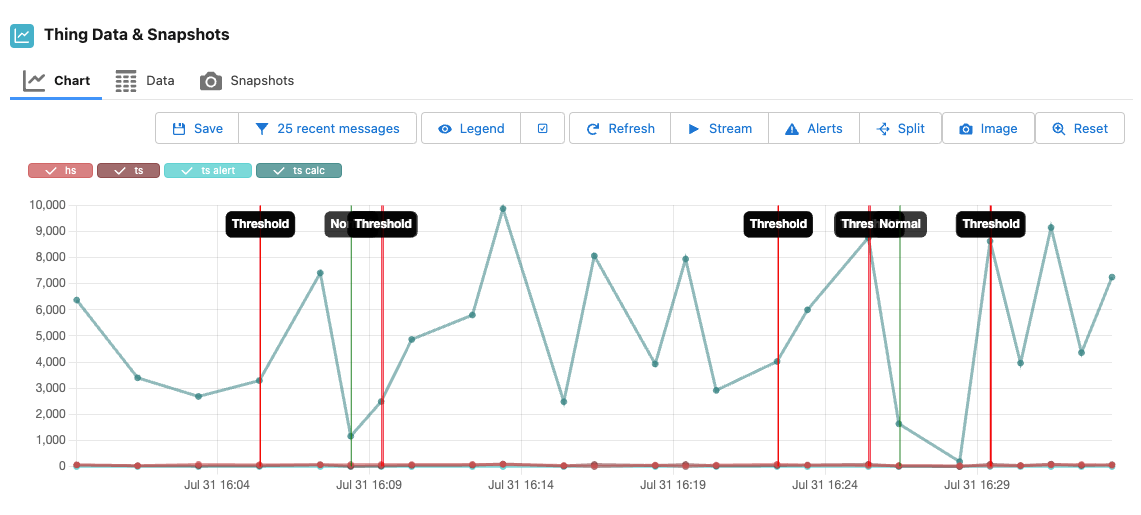
Thing Data Chart: Alerts
Legend
The Thing Chart Legend can be configured in the Lightning Record Page setup as:
- Salesforce: The legend will be rendered as Lightning Web Component “widgets”, separate from the Graph itself. (Default)
- Built-In: The legend will be rendered as part of the Chart widget itself.
Note
The Salesforce view is more robust, adapts to Split axes, and does not affect the rendering of the Chart itself. However, the Built-In view is useful when capturing an Image of the Chart as an Attachment, so the legend is included.Split Axes
The Thing Chart can now split the plotted values across 3 Axes by separating them by their maximum absolute values.
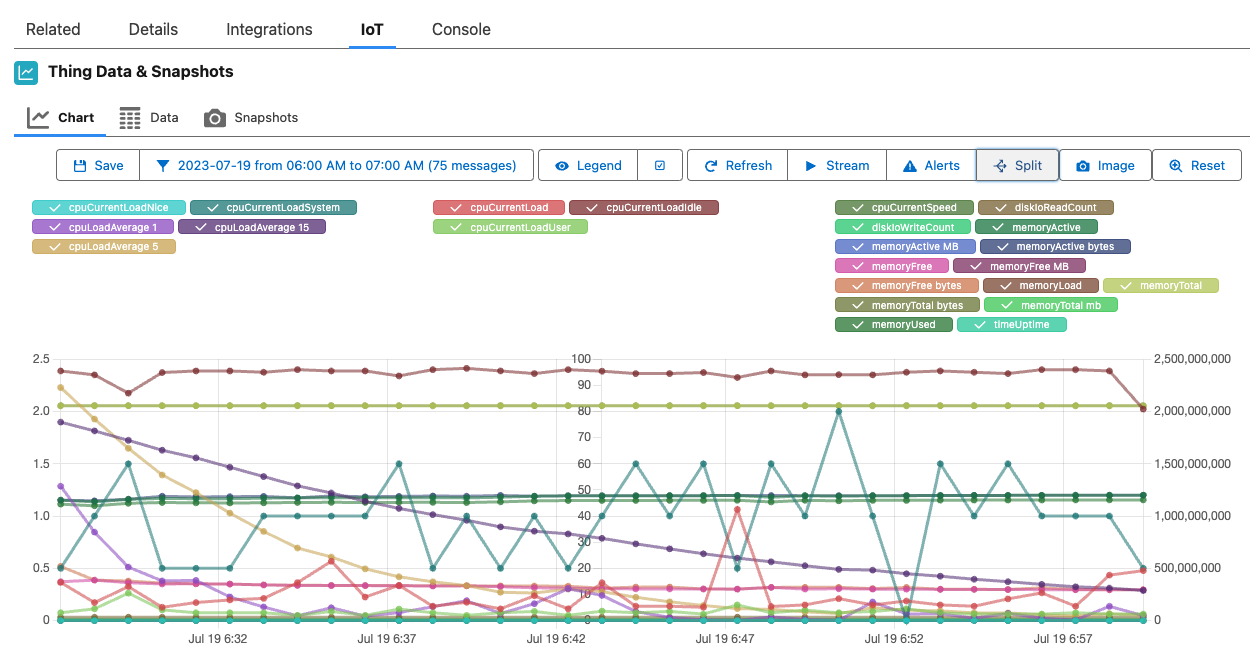
Thing Data Chart: Split
Note
By default these splits are defined as 0-10, 10-100 and 100+ but these ranges can be customized in the Lightning Record Page editor.Thing Commands
This component allows the user to send a Command to a thing. Bolt Data Connect will route your command to the IoT Cloud, then the Edge Gateway, and ultimately to the device itself. Keep in mind that the device must know how to interpret this command for it to respond accordingly.
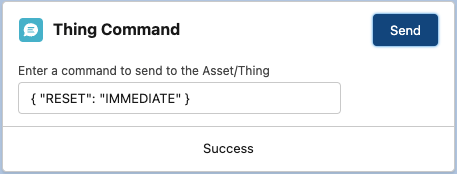
Thing Command
Digital Twins
See the Digital Twin Diagram / Editor
On the Thing Record Page, add the IoT Digital Twin and easily view/edit the Digital Twin from any Thing in the configured Hierarchy.
The Diagram shows all of the most recent sensors and calculated fields from all Things in the same Digital Twin.
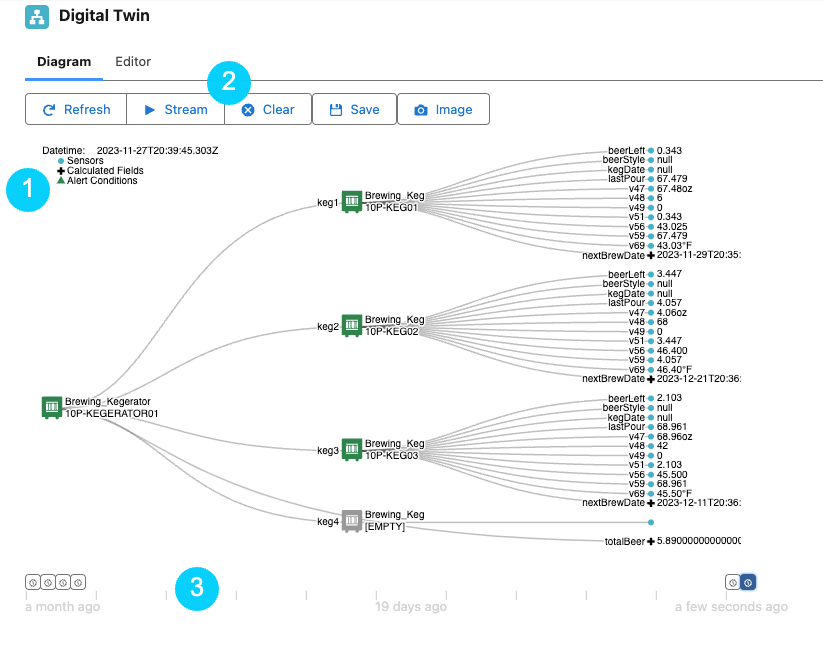
Digital Twin Viewer
-
The Legend shows the notation of the diagram including Sensors, Calculated Fields and Alert Conditions
-
Use the Digital Twin Toolbar to:
- Refresh the latest values
- Stream to subscribe to IoT Cloud messages as they are received
- Clear to reset and clear history values not already saved as IoT Snapshots
- Save to create an IoT Snapshot from the currently selected Digital Twin point-in-time
-
Select a different point-in-time to view the Digital Twin values from that time
Visual Twins
See the Visual Twin Editor for configuring the Visual Twins in IoT Setup.
On the Thing Record Page, add the IoT Visual Twin and easily view the configured Visual Twin from any Thing. The component shows the uploaded Image, as well as real-time IoT data in to the configured Annotations. Simply hover over any annotation area to see the IoT Values.
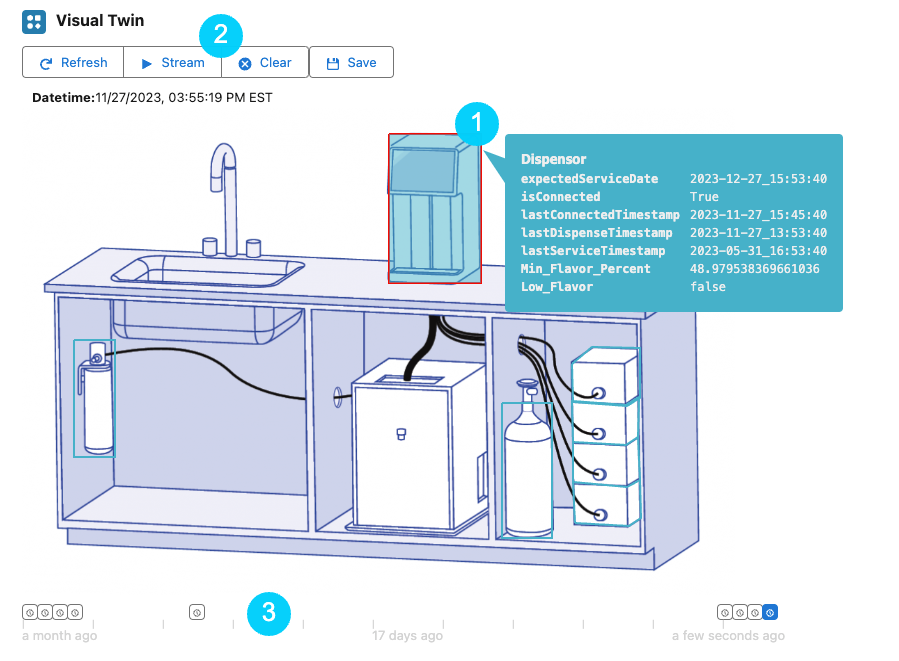
Visual Twin Viewer
-
Hover over an Annotation to view the IoT Field values
-
Use the Visual Twin Toolbar to:
- Refresh the latest values
- Stream to subscribe to IoT Cloud messages as they are received
- Clear to reset and clear history values not already saved as IoT Snapshots
- Save to create an IoT Snapshot from the currently selected Visual Twin point-in-time
-
Select a different point-in-time to view the IoT Field values from that time
Thing Timeline
On the Thing Record Page, add the IoT Thing Timeline and easily view the configured Timeline events for any Thing. The component shows the events of each configured type related to the Thing.
Included in the initial release, the following IoT Timeline Configuration (Custom Metadata) have been included:
- IoT Registrations
- IoT Alert History
- Asset Downtime Periods
- Servitization Coverage
- Cases
- Work Orders
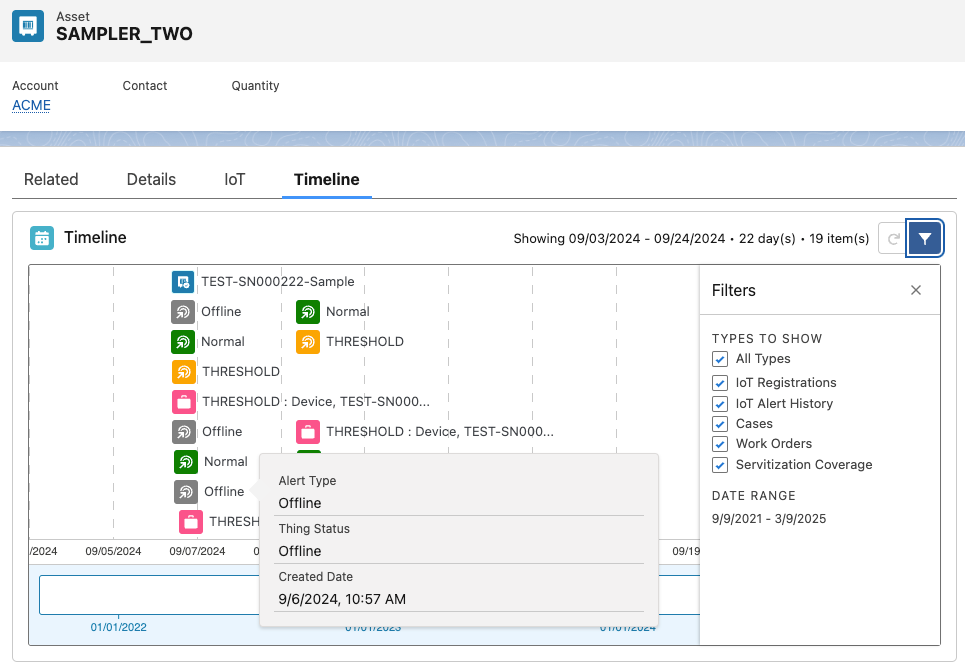
Thing Timeline
Note
Any other Timeline object/event can be configured in:
Setup > Custom Metadata Types > IoT Timeline Configurations.
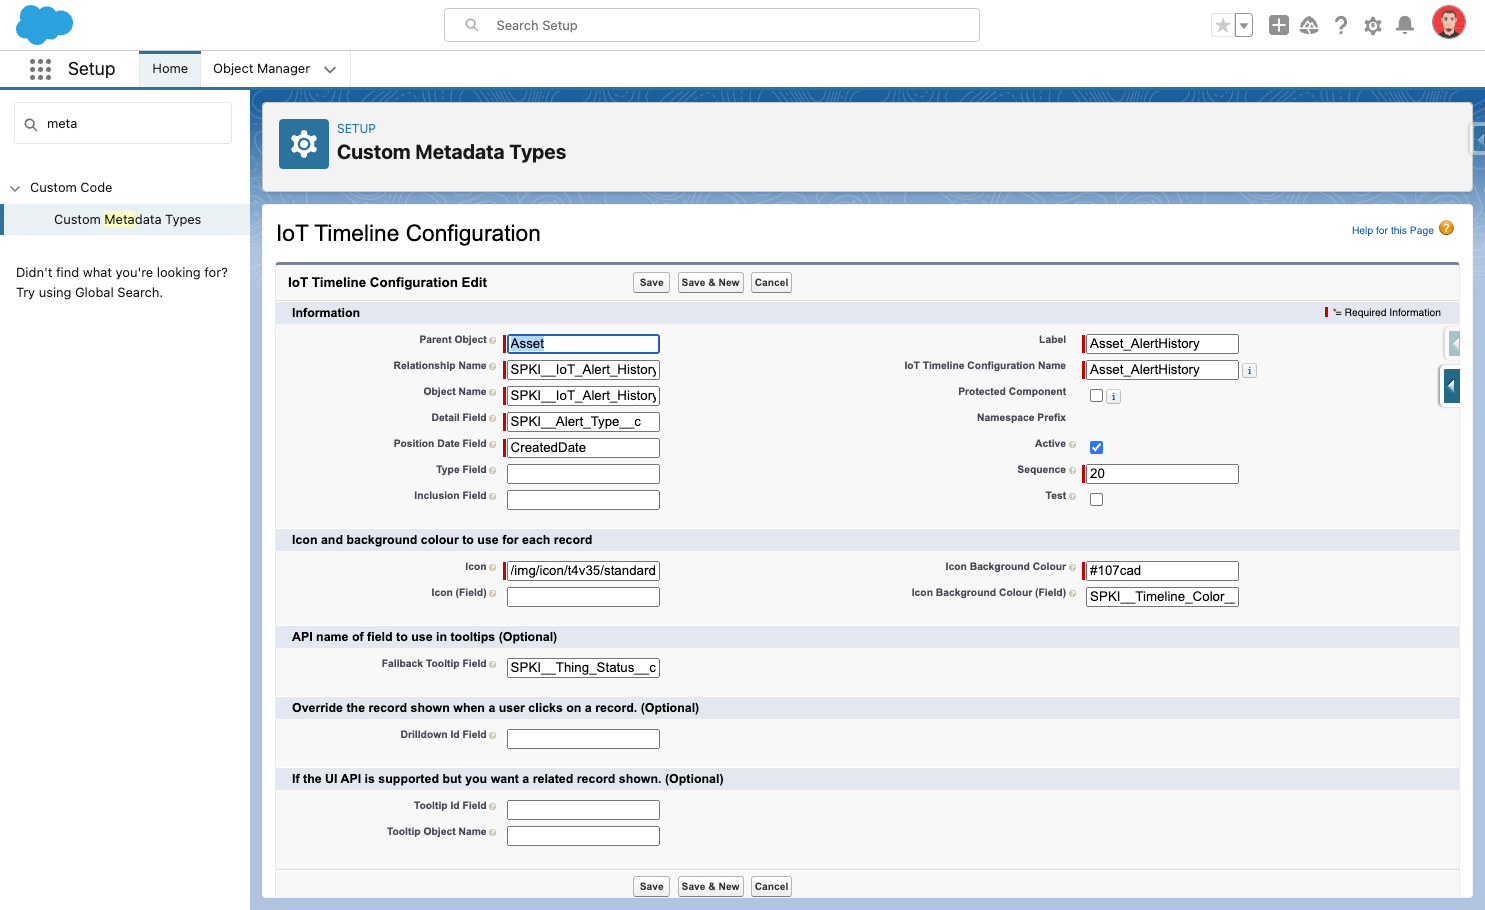
IoT Timeline Configuration
IoT Copilot
Add the IoT Copilot to the Asset Lightning Record page to give your users the ability to ask natural language questions in a chat window. They can ask questions about an asset’s performance based on IoT telemetry data and alert history, unlocking instant insights.
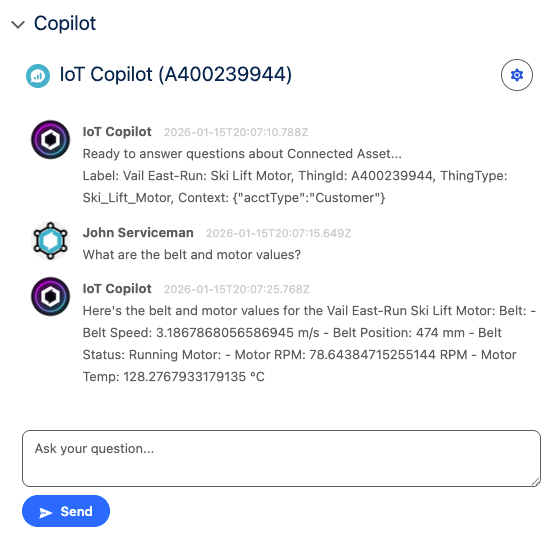
IoT Copilot
Note
Salesforce AgentForce licensing is not needed to take advantage of the IoT Copilot. We are using Generative AI models behind our IoT Cloud API layer, utilizing a world-class Trust Layer to protect the data and privacy.
If you are using Agentforce, the IoT Copilot integrates easily via Agentforce Actions. This integration enables users to access real-time insights on asset performance directly within Agentforce, providing a richer user experience. Please reach out to our support team for more information.
When adding the IoT Copilot to a Lightning Record Page, you can configure the following options:
- Default Model:
- Bot Name (IoT Copilot is the default)
On the IoT Copilot component, you can also click the setup icon to try a different model:
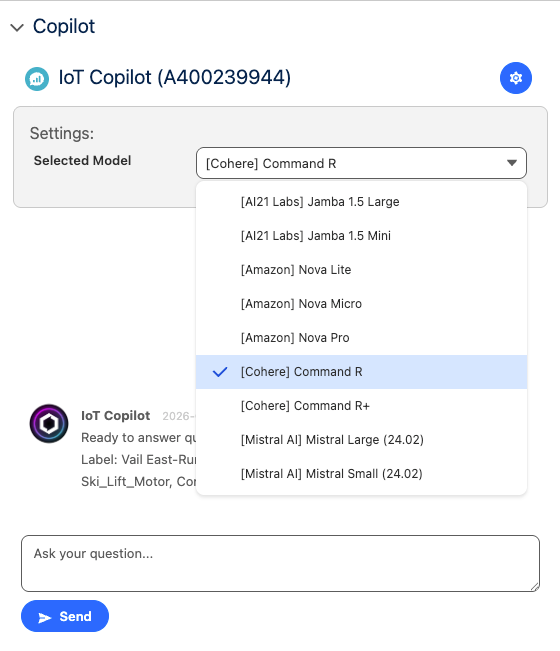
IoT Copilot Models
Advanced
The Generative AI Prompts can be also be customized by modifying these Custom Labels:
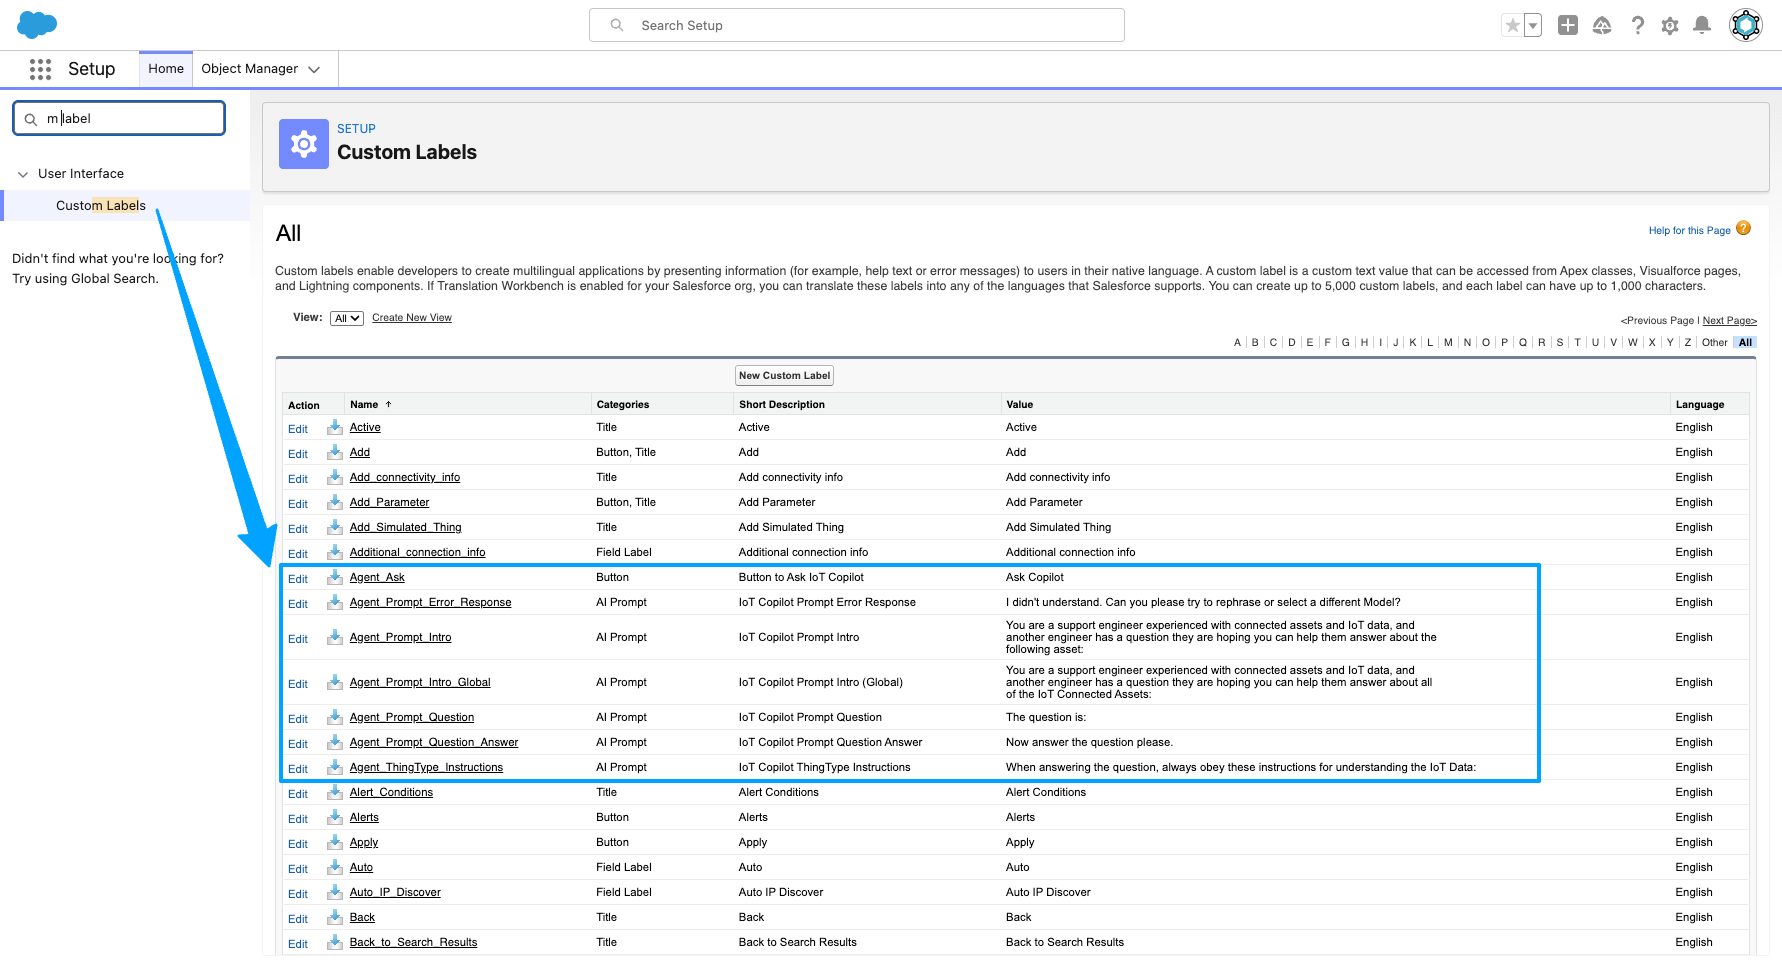
IoT Copilot Prompts
Sensor Gauges
The “IoT Sensor Gauge” Lightning Web Component (LWC) can be added to a Screen Flow to render sensor values as Gauges or Progress Bars/Rings. In addition, we’ve provided a Custom Action and Screen Flow template to ease the setup.
-
Create a New Screen Flow, using the IoT Gauges Template
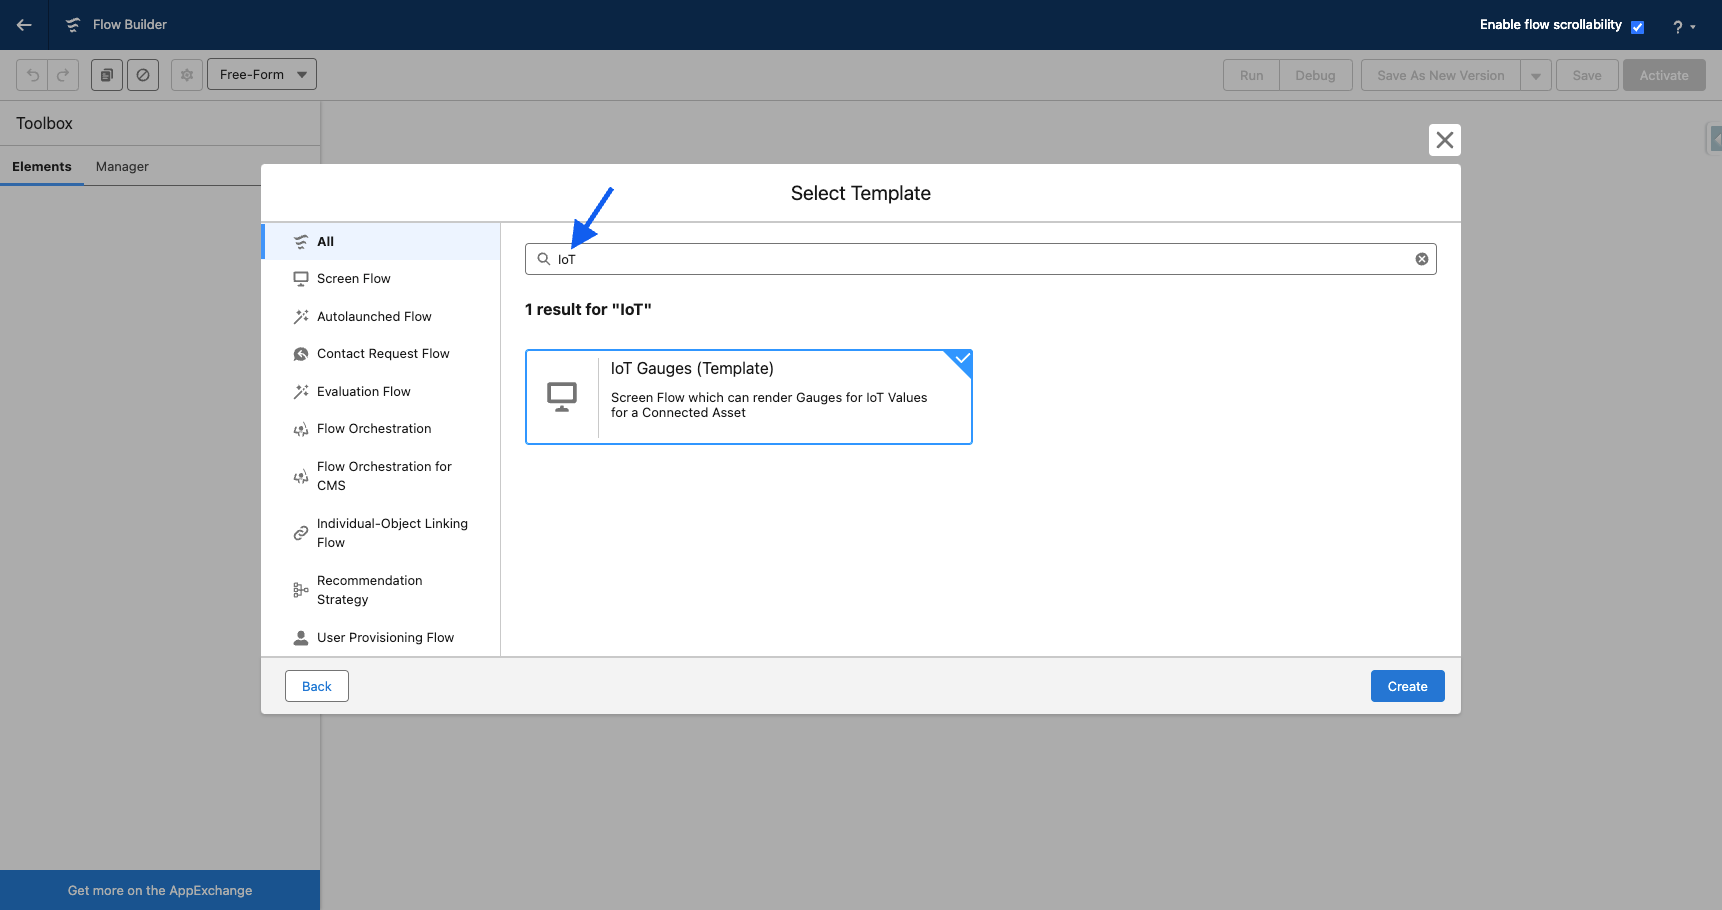
IoT Gauges Flow Template
-
In the Flow editor, feel free to add/remove/edit the IoT Sensor Gauge components as you’d like. Make sure to fill in the “IoT Values (JSON)” with the value returned from the provided Action.
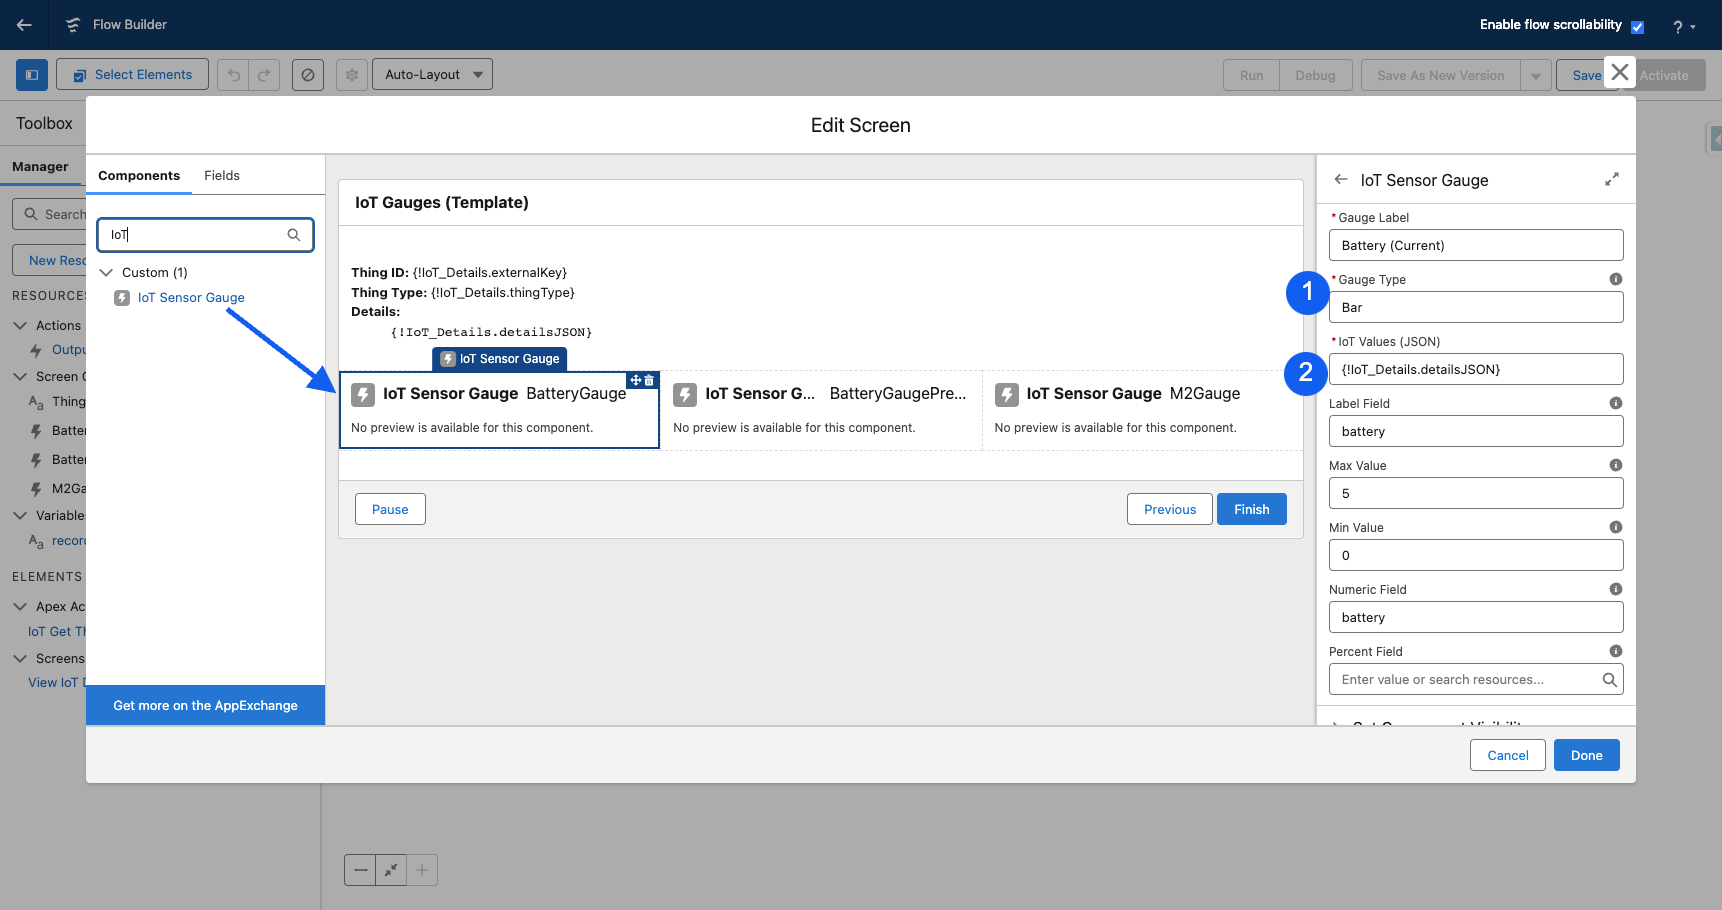
Sensor Gauges Flow Editor
-
Add the Screen Flow to the Lightning Record Page to view Sensor Gauges:
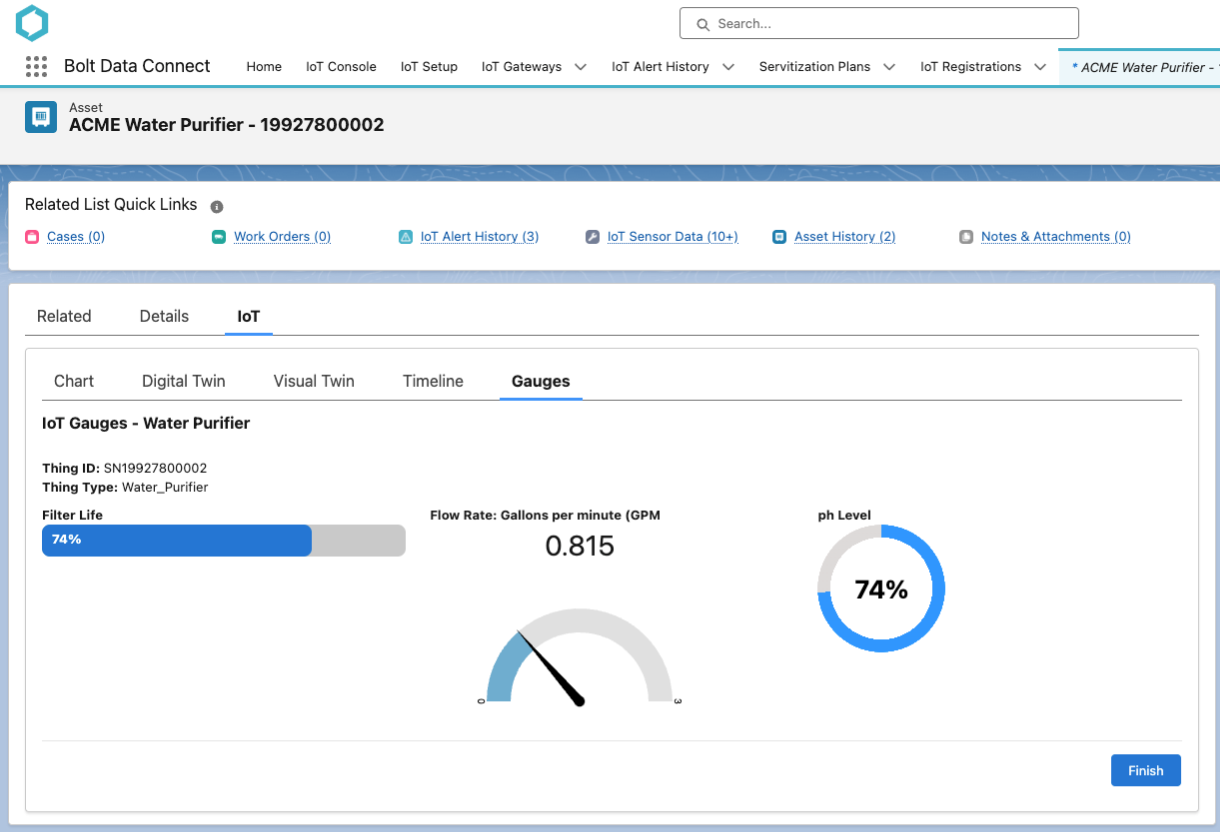
Sensor Gauges